
Awareness gaps, seller misconceptions, and competition in expensive markets continue to limit VA loan use, even though the benefit can be a powerful tool for affordability.
Housing markets across the country are missing out on tens of thousands of VA loans each year – an absence that adds up to billions in lost volume.
A new analysis from Veterans United Home Loans finds that more than 58,000 VA loans go “untapped” annually across U.S. metros, representing nearly $28 billion in unused VA loan volume in 2024 alone.
This shortfall reflects the gap between how often Veterans use the benefit nationally and how often they use it in specific housing markets. Despite the VA loan’s growing popularity since the Great Recession, usage remains uneven and disproportionately low in many metros compared to the size of their Veteran populations.
“Even in some of the country’s most competitive and expensive housing markets, thousands of Veterans might be missing out on the advantages of this benefit,” said Chris Birk, vice president of mortgage insight at Veterans United. “These findings show where greater awareness and access could make a major difference.”
Billions in Untapped VA Loan Volume
To measure the scope of underutilization, Veterans United modeled how many additional VA loans might occur if each metro’s usage matched the national share, adjusted for the size of the Veteran population.
We also estimated the dollar value of this gap by multiplying the number of “missing” VA loans by the median home listing price in each metro. The result: $27.9 billion in unused VA loan volume nationwide.
Some markets stand out more than others. Metros like New York, Los Angeles and Boston each exceeded $1 billion in estimated lost VA loan volume. High-cost areas such as San Francisco, Seattle and San Jose followed closely behind. These are pricier markets where affordability is already a challenge and where the VA loan could have had a particularly meaningful impact.
Top 25 Metro Areas for “Untapped” VA Loans
Nationally, VA loans have accounted for about 10-12% of the mortgage market in recent years. That figure fell to about 8% in 2024, according to HMDA data, driven in large part by the tough rate and affordability environment.
Our analysis defined underutilization by comparing the VA loan’s market share to the share of Veterans in each metro area. If VA usage was lower than expected given the size of the Veteran population, then the metro was deemed “underutilized” when it comes to the benefit. Markets with proportional usage were considered “balanced,” while those well above expectation were classified as “well-served.”
This map shows where more VA loans might happen if Veterans in each metro area used the benefit at the same rate as the national average. The map also highlights the 25 most underutilized metros. Each small blue dot represents a home loan that wasn’t a VA loan but could have been if local usage reflected national trends.
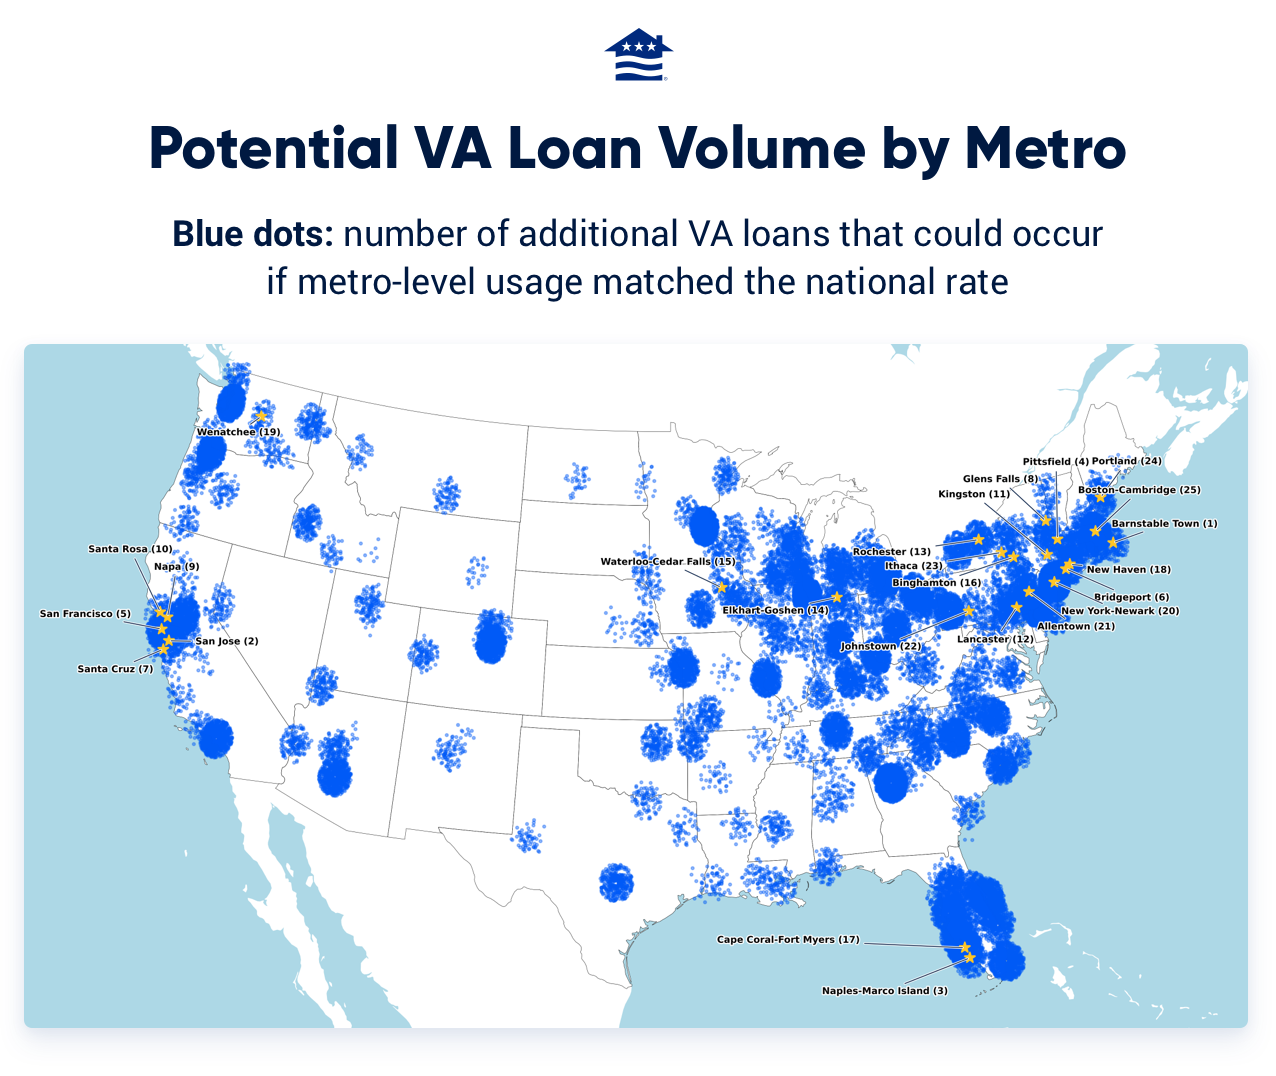
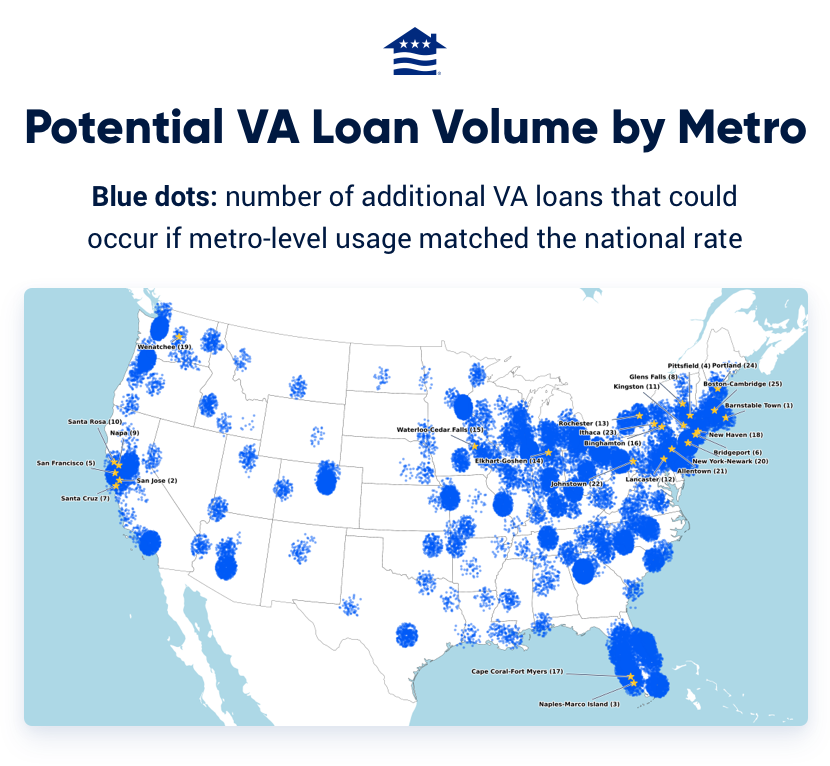
Below are the 25 metros with the largest gaps between eligible Veteran populations and VA loan use (a bigger Veteran Population Share to VA Loan Share indicates a greater gap):
| Rank (Biggest Difference, Proportionately) | Metro | Veteran Population Share 2024 | VA Market Share 2024 | Median Income 2024 | “Untapped” VA Loan Volume: |
|---|---|---|---|---|---|
| 1 | Barnstable Town, MA | 6.35% | 2.51% | $94,452 | $235,099,803 |
| 2 | San Jose-Sunnyvale-Santa Clara, CA | 2.12% | 0.84% | $157,444 | $476,864,635 |
| 3 | Naples-Marco Island, FL | 5.35% | 2.81% | $86,173 | $276,585,160 |
| 4 | Pittsfield, MA | 4.67% | 2.49% | $72,565 | $39,519,803 |
| 5 | San Francisco-Oakland-Fremont, CA | 2.65% | 1.46% | $133,780 | $888,082,275 |
| 6 | Bridgeport-Stamford-Danbury, CT | 2.65% | 1.47% | $111,656 | $211,133,231 |
| 7 | Santa Cruz-Watsonville, CA | 2.89% | 1.72% | $109,266 | $50,640,158 |
| 8 | Glens Falls, NY | 6.88% | 4.15% | $74,953 | $30,572,266 |
| 9 | Napa, CA | 5.13% | 3.18% | $108,970 | $70,200,184 |
| 10 | Santa Rosa-Petaluma, CA | 3.89% | 2.42% | $102,840 | $145,719,897 |
| 11 | Kingston, NY | 3.51% | 2.18% | $81,804 | $29,463,901 |
| 12 | Lancaster, PA | 4.78% | 3.19% | $83,703 | $99,328,264 |
| 13 | Rochester, NY | 4.76% | 3.22% | $74,438 | $125,561,880 |
| 14 | Elkhart-Goshen, IN | 4.23% | 2.88% | $65,617 | $29,423,654 |
| 15 | Waterloo-Cedar Falls, IA | 4.85% | 3.31% | $68,916 | $32,571,873 |
| 16 | Binghamton, NY | 5.36% | 3.70% | $63,347 | $21,425,467 |
| 17 | Cape Coral-Fort Myers, FL | 6.66% | 4.61% | $73,099 | $465,336,883 |
| 18 | New Haven-Milford, CT | 3.77% | 2.64% | $86,266 | $85,713,230 |
| 19 | Wenatchee, WA | 6.44% | 4.56% | $79,007 | $54,476,301 |
| 20 | New York-Newark-Jersey City, NY-NJ | 2.19% | 1.56% | $97,334 | $1,885,780,165 |
| 21 | Allentown-Bethlehem-Easton, PA-NJ | 5.01% | 3.58% | $82,602 | $175,408,331 |
| 22 | Johnstown, PA | 6.98% | 5.03% | $56,292 | $8,386,025 |
| 23 | Ithaca, NY | 2.75% | 1.99% | $73,012 | $6,551,994 |
| 24 | Portland-South Portland, ME | 6.12% | 4.49% | $88,602 | $255,033,656 |
| 25 | Boston-Cambridge-Newton, MA-NH | 3.39% | 2.58% | $112,484 | $1,129,733,191 |
These metros span the Northeast, Midwest, and West Coast, with a mix of high-cost coastal cities and smaller inland communities.
Why the Gap Exists
So why isn’t the VA loan being used in these markets?
The 25 metros with the largest VA loan usage gaps share common traits: high home prices, poor affordability ratios, and average to low Veteran population shares. These markets aren’t underperforming simply because they have fewer Veterans, but because the Veterans who do live there use the VA loan at lower rates than expected.
Nearly all of these metros have median incomes above the national metro median of $65,044, and home listing prices far above the national median of $342,000. High-cost markets, especially in California, can be particularly unforgiving for Veterans seeking to use the VA loan benefit. In these competitive environments, cash offers and conventional financing often dominate, pushing VA buyers to the sidelines.
Tight housing competition, seller misconceptions about delays or red tape, and lending industry preferences can make it harder for Veterans to use the benefit. Some buyers may even feel pressure to go conventional to win a bid, while others may not realize how favorable VA loan terms actually are.
“This doesn’t mean every one of these loans should have been a VA loan,” Birk said. “But the gaps highlight real opportunities to help more Veterans buy homes with a benefit they’ve earned.”
Methodology
This study analyzes VA loan utilization across U.S. metropolitan statistical areas (MSAs) using data from two primary sources: the American Community Survey (ACS) conducted by the U.S. Census Bureau, and the Home Mortgage Disclosure Act (HMDA) loan-level dataset.
Because official 2024 Veteran population estimates by metro area were not yet available, we projected these figures using a proportional method. First, we calculated each MSA's Veteran share of the total population based on the most recent available data. We then applied that percentage to the 2024 total population estimates to arrive at projected Veteran population figures for each metro area. We also calculated the Veteran population growth rate over the six-year period and found the estimated 2024 Veteran population based on population growth trends. The final 2024 Veteran population estimate for each metro was derived by averaging the results of both methods.
VA loan utilization was calculated by dividing the number of VA loans originated in a given MSA by the total number of home loans originated in that MSA. This produced a VA loan market share for each metro.
To assess whether an MSA is underutilizing the VA loan benefit, we divided the Veteran population share by the VA loan utilization rate to represent the “VA Loan Opportunity Index.”
- If the VA loan share was meaningfully lower than the Veteran share, the metro was considered to be underutilizing the benefit.
- If the VA loan share was roughly in line with the Veteran share, it was considered balanced.
- If the VA loan share exceeded the Veteran share, the metro was categorized as well-served.
These ‘brackets’ were created by finding the mean amongst all metros and finding where each metro fell within the standard deviation. This allowed us to analyze how each MSA was performing relative to other MSAs. We also conducted an analysis based on the national benchmark to see how MSAs compared nationally, not just among other metros.
To estimate the potential number of VA loans that could have been originated in each metro area, we applied a national benchmark of VA loan efficiency. This benchmark was derived from the national “VA Loan Opportunity Index,” calculated as the ratio of the Veteran population share to VA loan utilization across all metros, which was 0.5819 in 2024. We used this as the expected standard for how efficiently the VA loan benefit could be used. For each metro, we then estimated the number of VA loans that would have occurred if that metro matched the national benchmark. This was done by dividing the metro’s Veteran population share by the national opportunity index to get an expected VA loan share, multiplying it by total loan originations, and subtracting the actual number of VA loans. The result represents the projected number of VA loans that were potentially “missed” in each metro.
How We Maintain Content Accuracy
Veterans United often cites authoritative third-party sources to provide context, verify claims, and ensure accuracy in our content. Our commitment to delivering clear, factual, and unbiased information guides every piece we publish. Learn more about our editorial standards and how we work to serve Veterans and military families with trust and transparency.

Related Posts
-
 How to Make an Offer on a HouseOnce you’ve found the right home, you need to know how to put together a purchase offer. Learn tips for putting an offer on a house with a VA loan.
 -
 What is Credit and Why It’s ImportantDiscover why credit matters when buying a house. Learn how a strong score unlocks lower rates, better loans, and more financial freedom.


